


TOP ELECTRONICS EXPORTS BY COMMODITY OF VALUE MORE THAN USD 300 MILLION
The graph shows the top electronics exports by commodity of value more than USD 300 Mn. The total electronic goods...
The graph shows the top electronics exports by commodity of value more than USD 300 Mn. The total electronic goods...

The graph compares the export of electronic goods for the first and second quarters of FY23-24 to FY24-25. During Apr-Oct...

The figure shows the percentage share of mobile phone exports from India to various international markets. The USA dominates the...

The data shows the total electronic goods exports from India to various countries and territories. The USA is the primary...
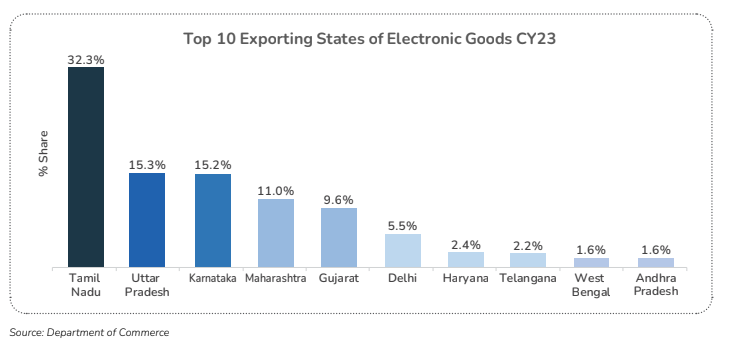
The data in Fig. 5 indicates the total exports from different states and union territories (UT) of India for the...
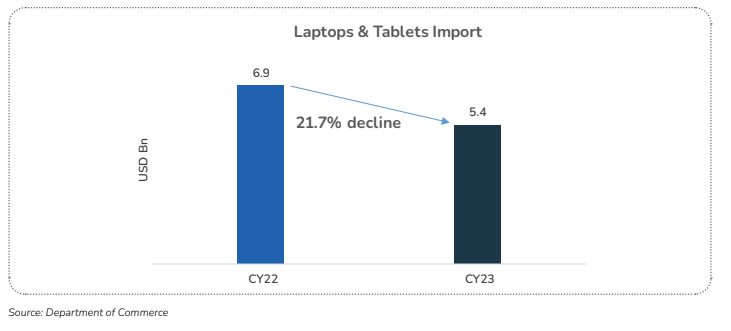
The above data presents a year-over-year comparison of Laptop & Tablets imports for CY22 and CY23. There’s a noticeable decrease...
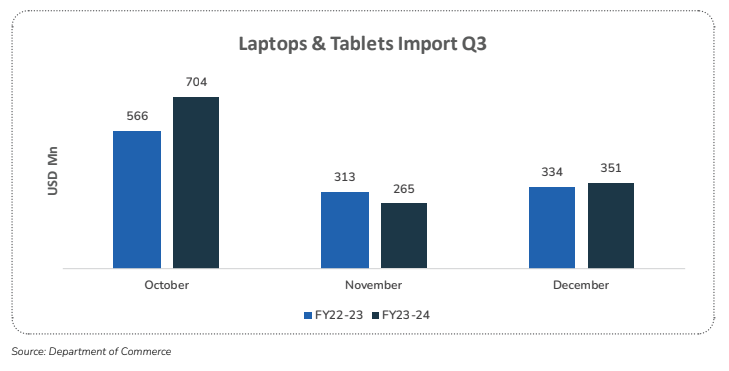
Fig. 4a shows imports of Laptops & Tablets for the third quarter (Q3) across two fiscal years (FY22-23 and FY23-24)....
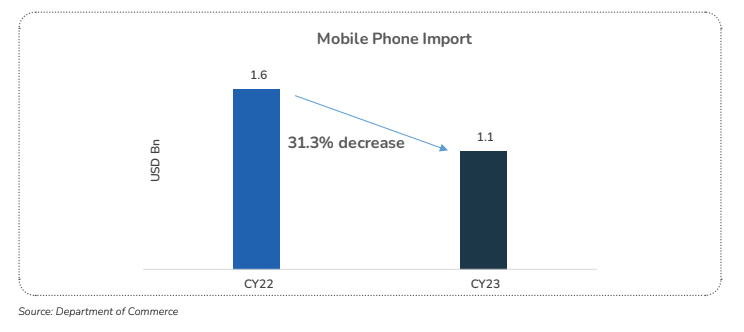
The Fig. 3b indicates a decrease in mobile phone imports from CY22 to CY23. In CY22, the imports stood at...
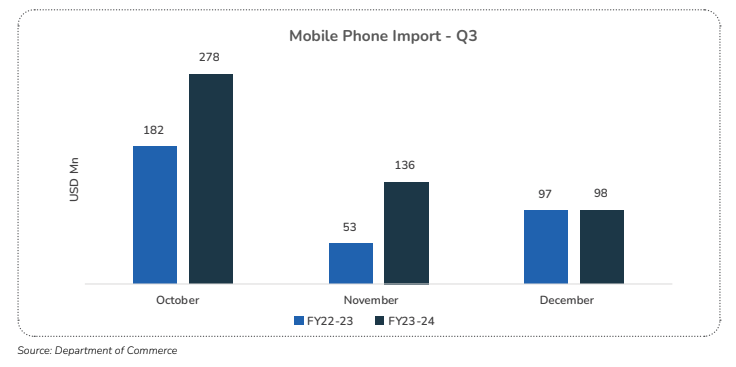
Fig. 3a indicates an increase in mobile phone imports in the third quarter of FY23-24 from FY22-23. However, the overall...
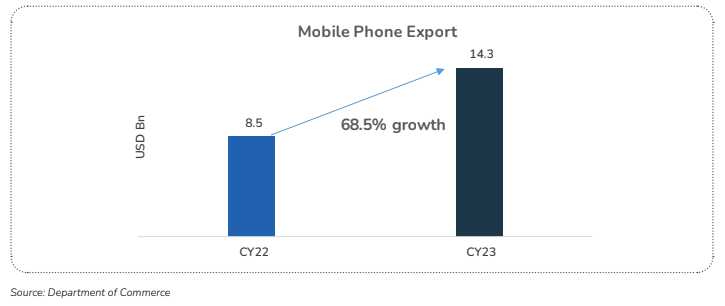
The data shows a significant year-over-year increase in mobile phone exports, with a rise of USD 8.5 Bn in CY2022...